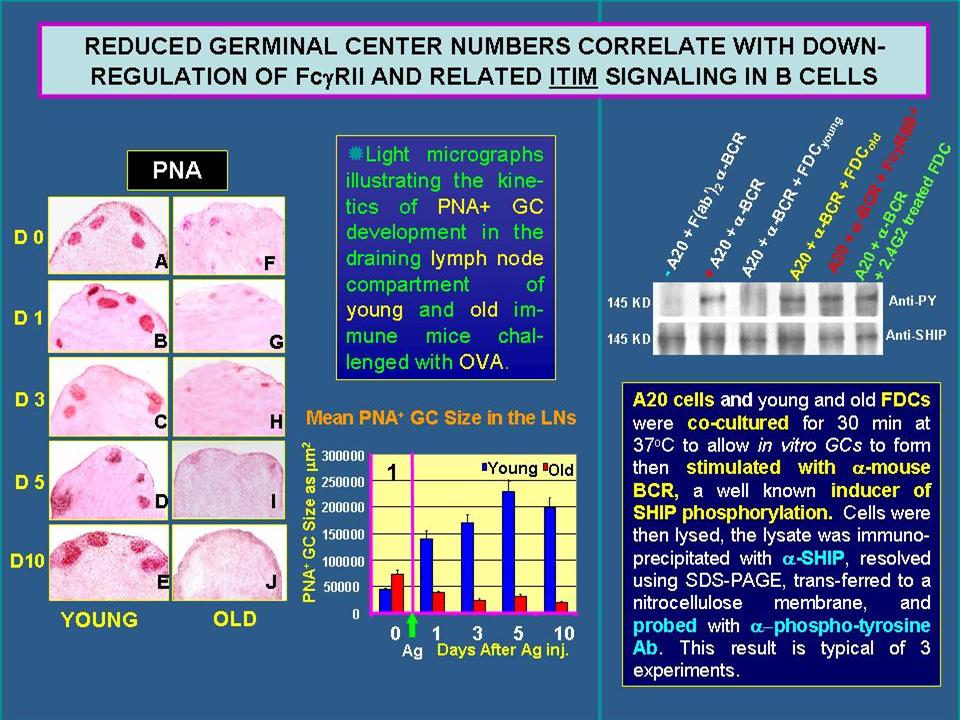
The left panel above shows representative sections of draining lymph nodes in young and old mice labeled with PNA-HRP for developing germinal centers from days 0 through 10 after Ag-ic challenge. Mean PNA+ germinal center size was determined and shown as bar graphs above (graph 1). Note that in old mice the Ag induced GC development is arrested and declines. This decline also parallels the downregulation of FcgRIIB and Ag-Ab trapping (see Pannel B). P<0.005 The panel on the right shows that incubation of B cells with young FDCs(y) reduced ITIM signaling as indicated by reduced SHIP phosphorylation when compared with B cells stimulated with anti-BCR. However, old FDCs(o) did not block SHIP phosphorylation in stimulated B cells. FDCs from FcgRII KO mice were even less effective.