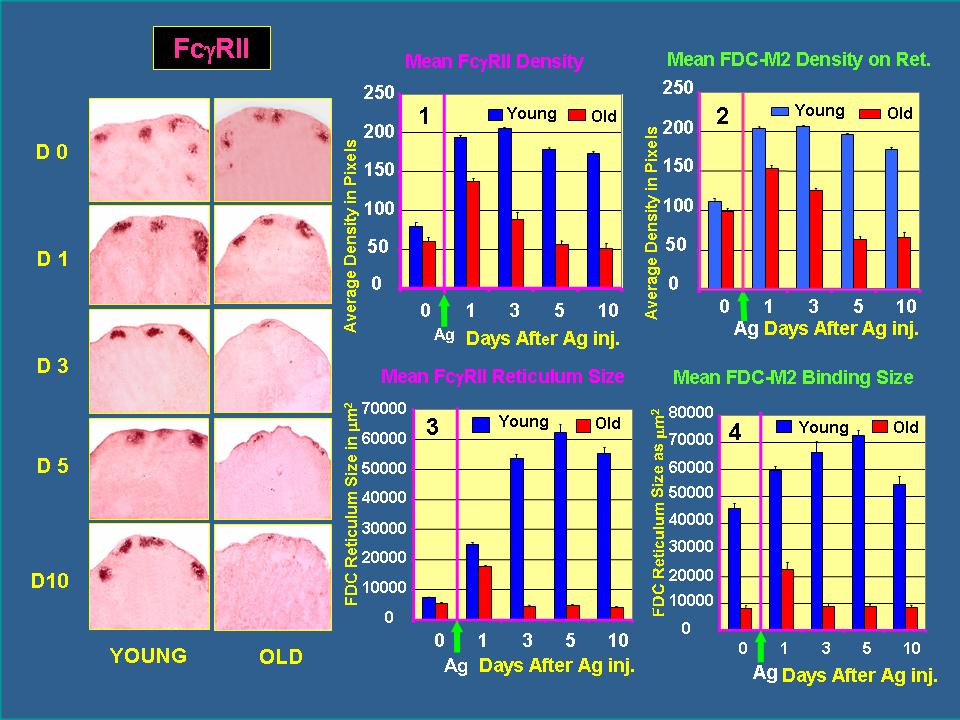
The Panel shows representative sections of draining lymph nodes stained for FcgRII on FDC reticula from days 0 through 10 after antigenic challenge. The mean density (graph1) and mean size (graph 2) for FcgRII labeling and FDC-M2 (graphs 3&4) which reflects immune complex binding to FDC reticula were determined and the kinetics of change is shown on graphs 1,2,3, & 4. Note that old mouse FDC reticula rapidly downregulate their FcgRII receptors after Ag injection which is also reflected in Ag binding by the FDCs as seen with FDC-M2 labeling (graph 4).